IHS/BFS/X/2
This page describes a signal of selection found in the
Burkina Faso An. gambiae populationusing the IHS (Cite et al. 20XX) statistic.The focus of this signal is on chromosome arm
X between positions 14,660,000 and
14,980,000.
The evidence supporting this signal is
strong ( >= 100 on both flanks).
Signal location. Blue markers show the values of the selection statistic. The dashed black line shows the fitted peak model. The shaded red area shows the focus of the selection signal. The shaded blue area shows the genomic region in linkage with the selection event. Use the mouse wheel or the controls at the top right of the plot to zoom in, and hover over genes to see gene names and descriptions.
Genes
The following 14 genes overlap the focal region: AGAP0008012 (GLURIIb - ionotropic receptor GLURIIb), AGAP0008032 (GLURIIa - ionotropic receptor GLURIIa), AGAP0008041 (GPXH2 - glutathione peroxidase 2), AGAP000805 (BTB/POZ domain-containing protein KCTD16), AGAP000806 (Angiopoietin-like 1), AGAP000807 (helix-loop-helix transcription factor), AGAP000808 (DNA damage-regulated autophagy modulator protein 2), AGAP013022, AGAP000809 (Proteasome 26S non-ATPase subunit 10), AGAP000810, AGAP000812 (calcium binding protein), AGAP0008131 (Frataxin homolog, mitochondrial), AGAP000814, AGAP000815 (INTB - integrin beta subunit).
The following 4 genes are within 50 kbp of the focal region: AGAP0007982 (GLURIIc - ionotropic receptor GLURIIc), AGAP000817, AGAP000816, AGAP013474.
Key to insecticide resistance candidate gene types: 1 metabolic; 2 target-site; 3 behavioural; 4 cuticular.
Overlapping selection signals
The following selection signals have a focus which overlaps with the focus of this signal.
| Signal | Statistic | Population | Focus | Peak model |
Max. percentile | Known locus |
|---|---|---|---|---|---|---|
| XPEHH/BFS.UGS/X/1 | XPEHH | Burkina Faso An. gambiae | X:14,960,000-15,140,000 | 961 | 99.9% | nan |
| IHS/UGS/X/1 | IHS | Uganda An. gambiae | X:14,640,000-15,360,000 | 517 | 96.7% | Cyp9k1 |
| IHS/BFM/X/1 | IHS | Burkina Faso An. coluzzii | X:14,760,000-15,620,000 | 501 | 100.0% | Cyp9k1 |
| H12/GNS/X/1 | H12 | Guinea An. gambiae | X:14,960,000-15,160,000 | 419 | 97.8% | nan |
| XPEHH/GAS.GWA/X/1 | XPEHH | Gabon An. gambiae | X:14,460,000-14,860,000 | 301 | 98.5% | nan |
| XPEHH/AOM.GWA/X/2 | XPEHH | Angola An. coluzzii | X:14,500,000-15,180,000 | 228 | 98.5% | nan |
| XPEHH/UGS.BFS/X/1 | XPEHH | Uganda An. gambiae | X:14,960,000-15,320,000 | 204 | 89.8% | Cyp9k1 |
Diagnostics
The information below provides some diagnostics from the Peak modelling algorithm.
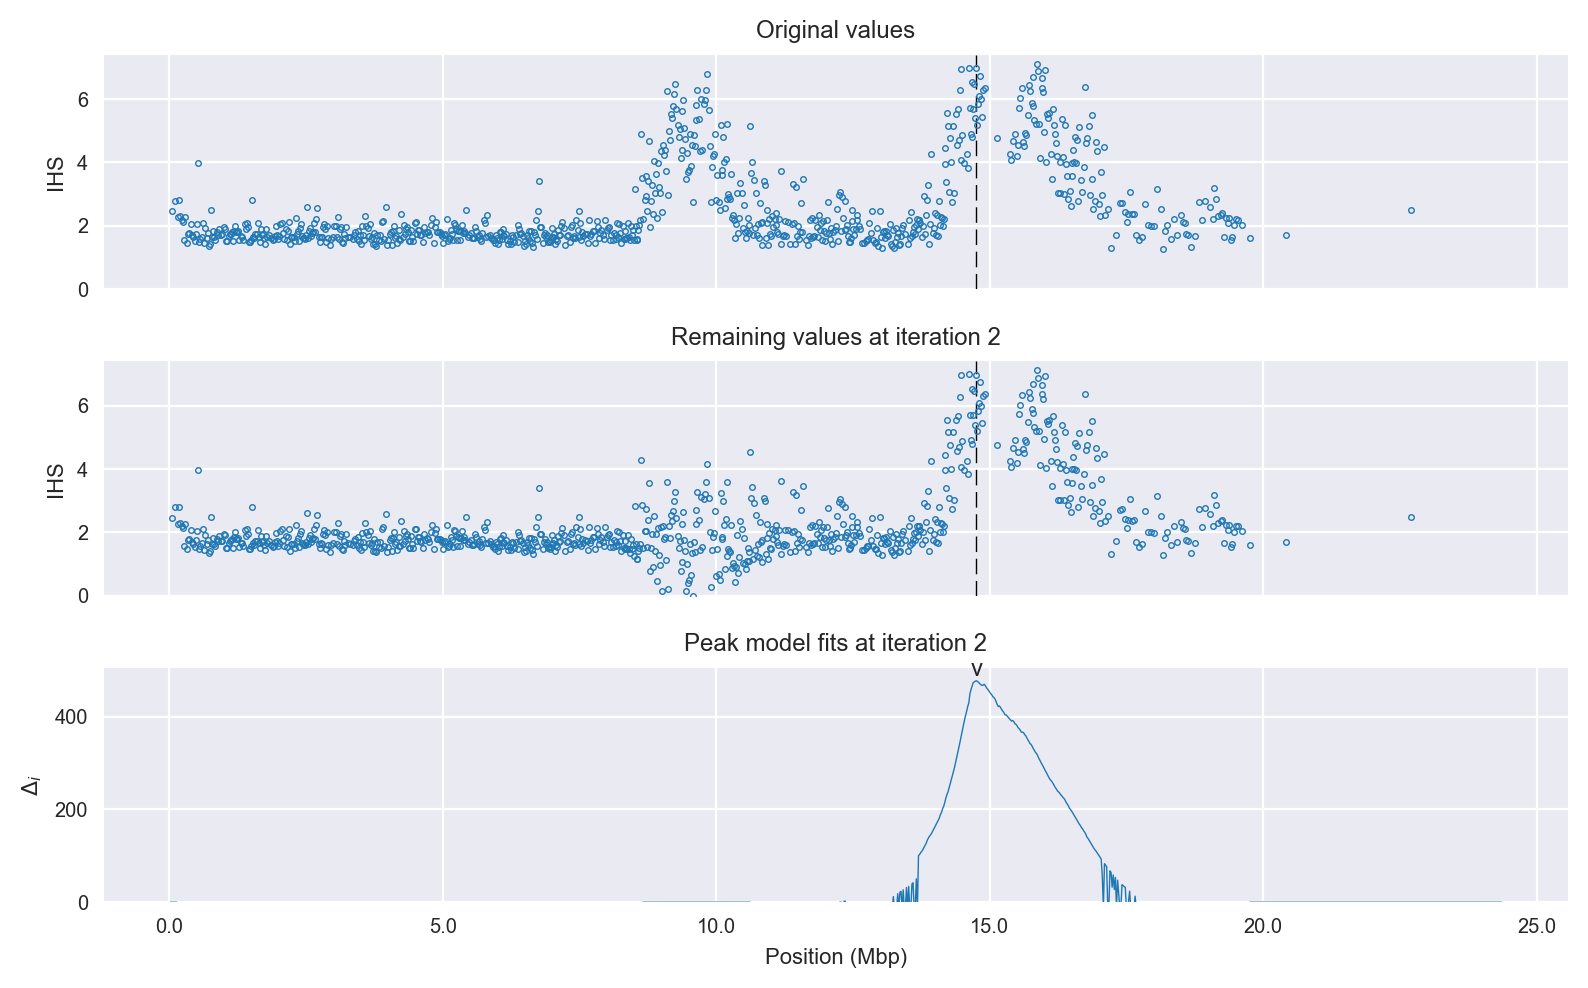
Selection signal in context. @@TODO
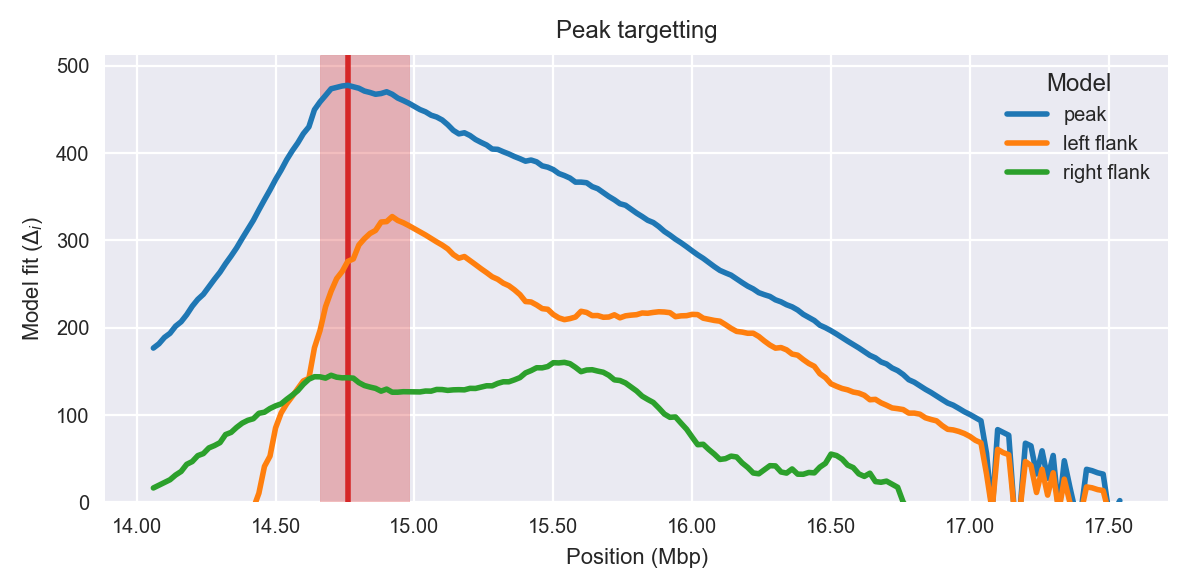
Peak targetting. @@TODO
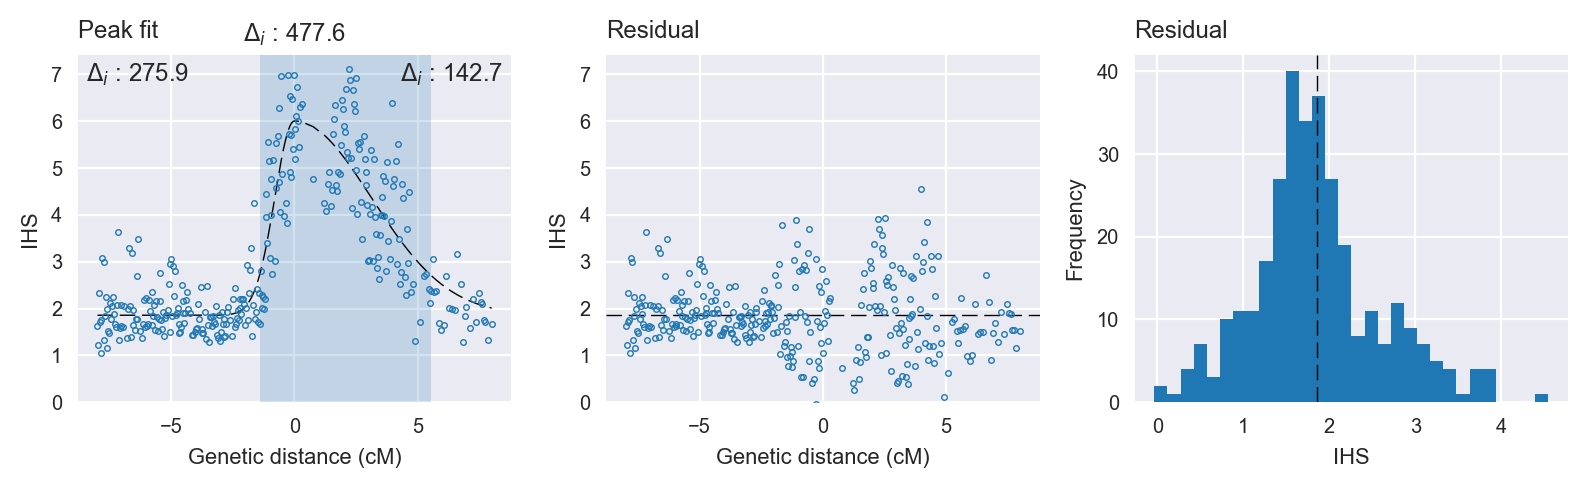
Peak fitting diagnostics. @@TODO
Model fit reports
Peak model:
[[Model]]
    Model(skewed_gaussian)
[[Fit Statistics]]
    # function evals   = 43
    # data points      = 323
    # variables        = 4
    chi-square         = 180.883
    reduced chi-square = 0.567
    Akaike info crit   = -179.275
    Bayesian info crit = -164.165
[[Variables]]
    center:      0 (fixed)
    amplitude:   4.14599474 +/- 0.134300 (3.24%) (init= 3)
    sigma:       1.57460529 +/- 0.063254 (4.02%) (init= 0.5)
    skew:       -0.98249570 +/- 0.041246 (4.20%) (init= 0)
    baseline:    1.85638222 +/- 0.061354 (3.31%) (init= 1)
    ceiling:     100 (fixed)
    floor:       0 (fixed)
[[Correlations]] (unreported correlations are <  0.100)
    C(sigma, baseline)           = -0.457
    C(amplitude, sigma)          = -0.347
    C(amplitude, baseline)       = -0.346
    C(sigma, skew)               =  0.278
Null model:
[[Model]]
    Model(constant)
[[Fit Statistics]]
    # function evals   = 11
    # data points      = 322
    # variables        = 1
    chi-square         = 808.107
    reduced chi-square = 2.517
    Akaike info crit   = 298.286
    Bayesian info crit = 302.060
[[Variables]]
    c:   3.01396105 +/- 0.088416 (2.93%) (init= 1)