XPEHH/UGS.BFS/X/1
This page describes a signal of selection found in the
Uganda An. gambiae population
when compared with the Burkina Faso An. gambiae population
using the XPEHH (Cite et al. 20XX) statistic.The focus of this signal is on chromosome arm
X between positions 14,960,000 and
15,320,000.
The evidence supporting this signal is
moderate ( >= 50 on both flanks).
This signal overlaps the Cyp9k1 locus, a genome region with prior evidence of an association with insecticide resistance and/or recent positive selection in Anopheles mosquitoes.
Signal location. Blue markers show the values of the selection statistic. The dashed black line shows the fitted peak model. The shaded red area shows the focus of the selection signal. The shaded blue area shows the genomic region in linkage with the selection event. Use the mouse wheel or the controls at the top right of the plot to zoom in, and hover over genes to see gene names and descriptions.
Genes
The following 11 genes overlap the focal region: AGAP000817, AGAP000816, AGAP013474, AGAP013173, AGAP013424, AGAP012997, AGAP0008181 (CYP9K1 - cytochrome P450), AGAP000819 (nuclear receptor subfamily 2 group E member (Tailless)), AGAP0008204 (CPR125 - cuticular protein RR-2 family 125), AGAP000821, AGAP000822.
The following 9 genes are within 50 kbp of the focal region: AGAP0008131 (Frataxin homolog, mitochondrial), AGAP000814, AGAP000815 (INTB - integrin beta subunit), AGAP000823 (CD81 antigen), AGAP000824 (bone morphogenetic protein 5), AGAP000825, AGAP000826 (cap-specific mRNA (nucleoside-2’-O-)-methyltransferase 1), AGAP000829 (calpain-15), AGAP000830 (CASPS7 - short caspase 7).
Key to insecticide resistance candidate gene types: 1 metabolic; 2 target-site; 3 behavioural; 4 cuticular.
Overlapping selection signals
The following selection signals have a focus which overlaps with the focus of this signal.
| Signal | Statistic | Population | Focus | Peak model |
Max. percentile | Known locus |
|---|---|---|---|---|---|---|
| H12/BFM/X/1 | H12 | Burkina Faso An. coluzzii | X:15,100,000-15,300,000 | 1,267 | 100.0% | Cyp9k1 |
| XPEHH/BFS.UGS/X/1 | XPEHH | Burkina Faso An. gambiae | X:14,960,000-15,140,000 | 961 | 99.9% | nan |
| XPEHH/BFS.GWA/X/1 | XPEHH | Burkina Faso An. gambiae | X:15,060,000-15,220,000 | 866 | 99.6% | Cyp9k1 |
| XPEHH/BFM.GWA/X/1 | XPEHH | Burkina Faso An. coluzzii | X:15,060,000-15,260,000 | 852 | 99.4% | Cyp9k1 |
| H12/BFS/X/1 | H12 | Burkina Faso An. gambiae | X:15,100,000-15,240,000 | 815 | 98.5% | Cyp9k1 |
| IHS/GNS/X/1 | IHS | Guinea An. gambiae | X:15,240,000-15,780,000 | 553 | 99.3% | Cyp9k1 |
| IHS/UGS/X/1 | IHS | Uganda An. gambiae | X:14,640,000-15,360,000 | 517 | 96.7% | Cyp9k1 |
| XPEHH/BFM.AOM/X/1 | XPEHH | Burkina Faso An. coluzzii | X:15,040,000-15,180,000 | 511 | 100.0% | nan |
| IHS/BFM/X/1 | IHS | Burkina Faso An. coluzzii | X:14,760,000-15,620,000 | 501 | 100.0% | Cyp9k1 |
| IHS/BFS/X/2 | IHS | Burkina Faso An. gambiae | X:14,660,000-14,980,000 | 477 | 99.9% | nan |
| H12/GNS/X/1 | H12 | Guinea An. gambiae | X:14,960,000-15,160,000 | 419 | 97.8% | nan |
| H12/UGS/X/1 | H12 | Uganda An. gambiae | X:15,160,000-15,480,000 | 348 | 94.9% | Cyp9k1 |
| XPEHH/UGS.CMS/X/1 | XPEHH | Uganda An. gambiae | X:15,240,000-15,460,000 | 284 | 99.9% | Cyp9k1 |
| XPEHH/AOM.GWA/X/2 | XPEHH | Angola An. coluzzii | X:14,500,000-15,180,000 | 228 | 98.5% | nan |
Diagnostics
The information below provides some diagnostics from the Peak modelling algorithm.
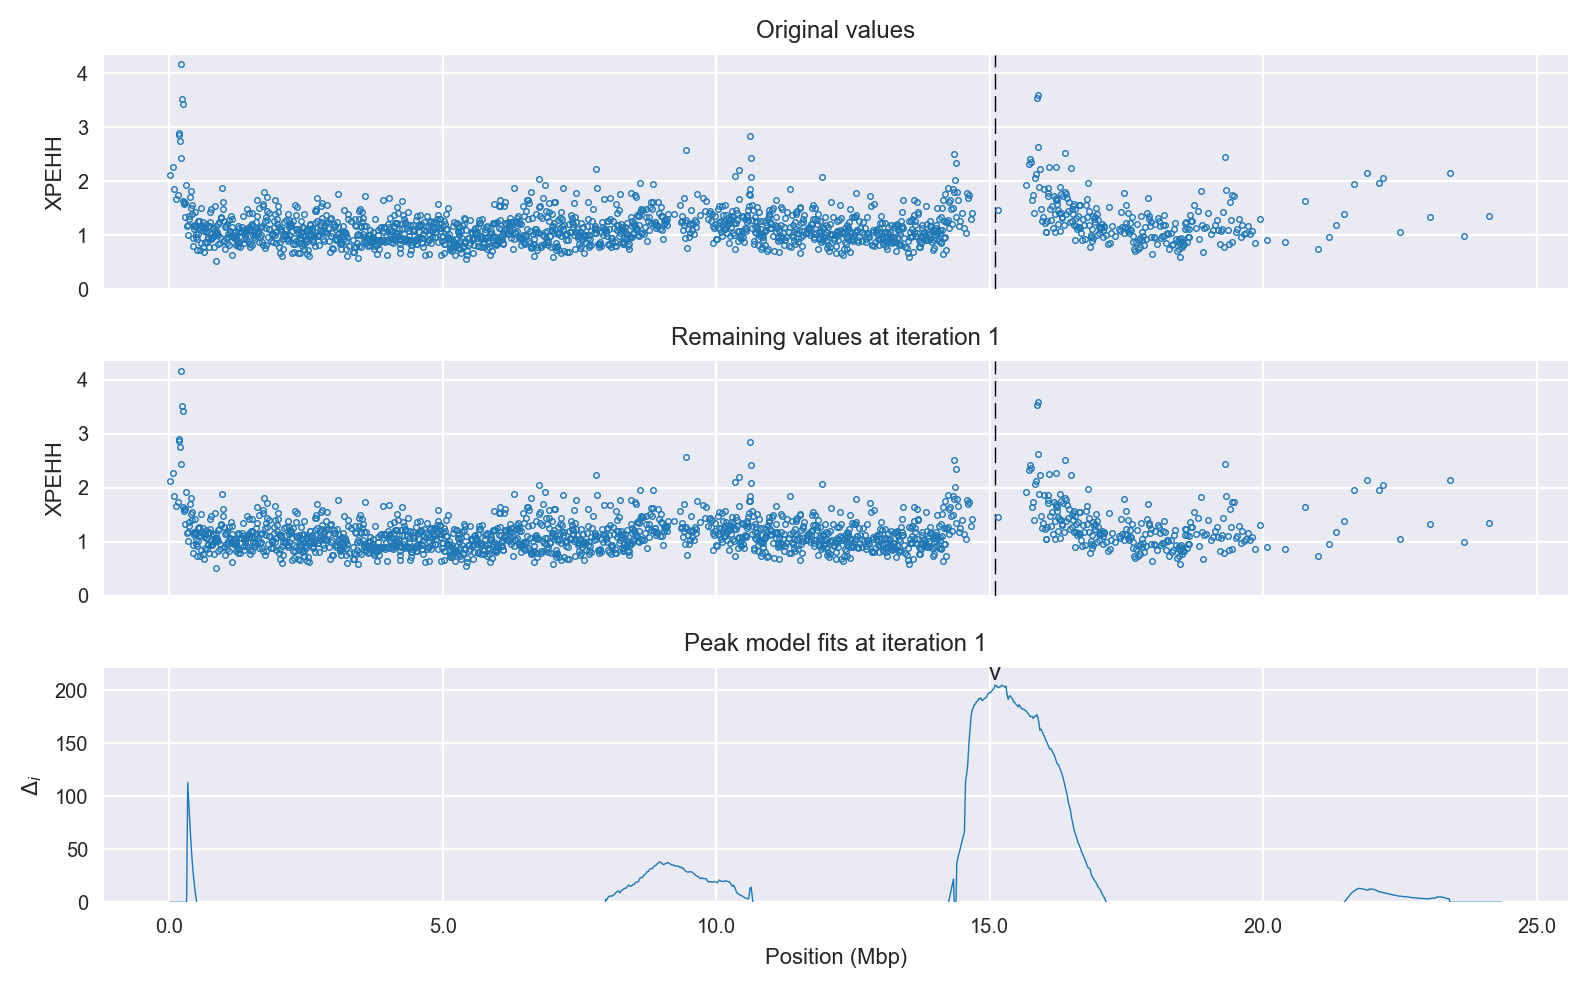
Selection signal in context. @@TODO
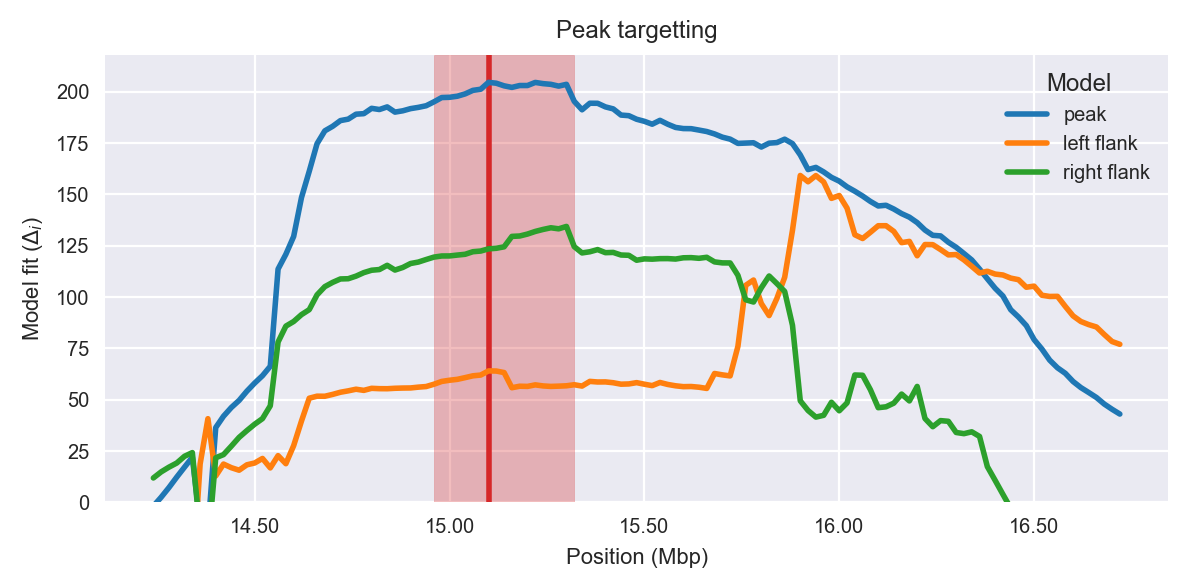
Peak targetting. @@TODO
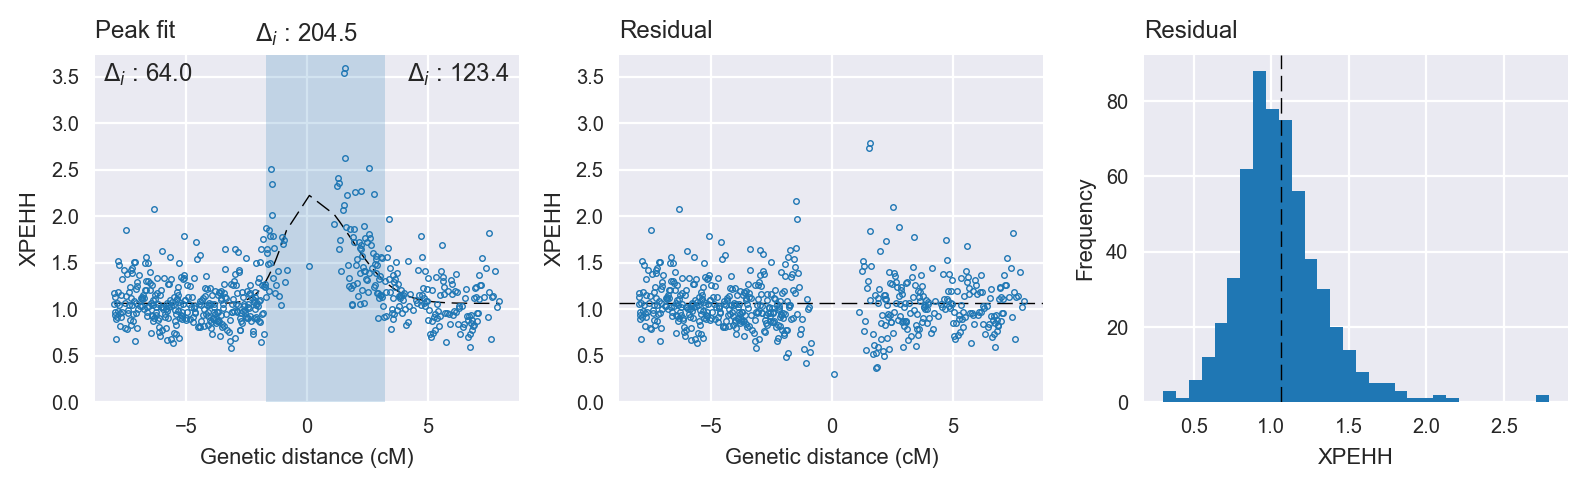
Peak fitting diagnostics. @@TODO
Model fit reports
Peak model:
[[Model]]
    Model(skewed_gaussian)
[[Fit Statistics]]
    # function evals   = 44
    # data points      = 565
    # variables        = 4
    chi-square         = 45.767
    reduced chi-square = 0.082
    Akaike info crit   = -1411.996
    Bayesian info crit = -1394.649
[[Variables]]
    center:      0 (fixed)
    amplitude:   1.16156867 +/- 0.101817 (8.77%) (init= 3)
    sigma:       1.31441569 +/- 0.077678 (5.91%) (init= 0.5)
    skew:       -0.45458350 +/- 0.047958 (10.55%) (init= 0)
    baseline:    1.06232733 +/- 0.015202 (1.43%) (init= 1)
    ceiling:     100 (fixed)
    floor:       0 (fixed)
[[Correlations]] (unreported correlations are <  0.100)
    C(amplitude, sigma)          = -0.729
    C(sigma, baseline)           = -0.438
    C(amplitude, skew)           =  0.191
Null model:
[[Model]]
    Model(constant)
[[Fit Statistics]]
    # function evals   = 9
    # data points      = 564
    # variables        = 1
    chi-square         = 66.060
    reduced chi-square = 0.117
    Akaike info crit   = -1207.493
    Bayesian info crit = -1203.158
[[Variables]]
    c:   1.17441547 +/- 0.014423 (1.23%) (init= 1)